
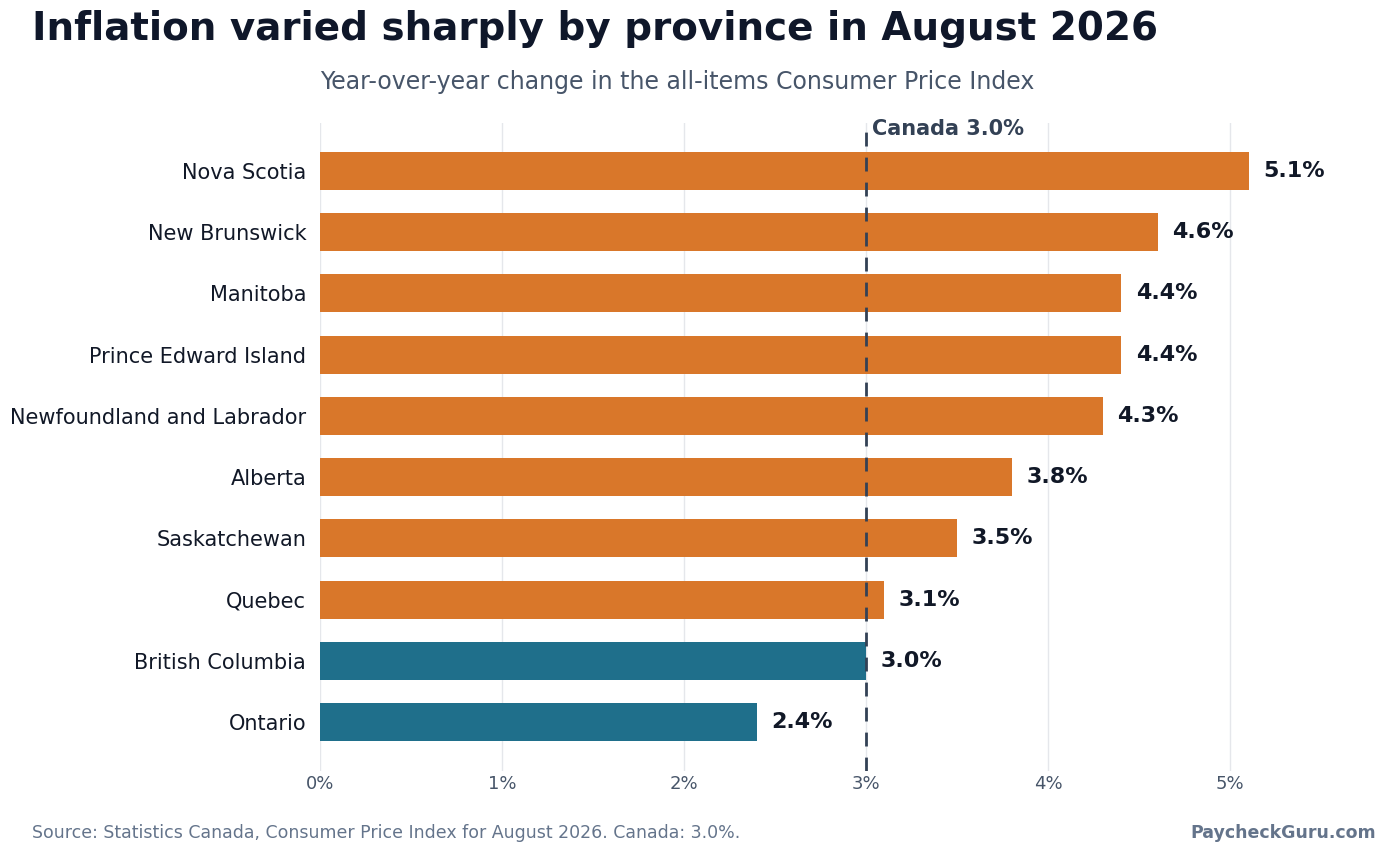
The Canada inflation rate held at 3.0% in August 2026, but that national figure did not describe any province except British Columbia. Ontario had the lowest provincial inflation rate at 2.4%. Nova Scotia had the highest at 5.1%.
That gap changes how a raise feels. On a $50,000 salary, a 3% raise adds $1,500 in gross annual pay. It matches or exceeds the August inflation benchmark only in Ontario and British Columbia. In Nova Scotia, keeping pace with the provincial rate would require a $2,550 gross increase, which is $1,050 more than a 3% raise.
These are gross salary benchmarks, not personalized after-tax results. Your spending mix, deductions and province all affect the amount that reaches your bank account.
Canada inflation rate stays at 3.0% in August
Statistics Canada reported that the Consumer Price Index (CPI) rose 3.0% from August 2025 to August 2026, matching July’s annual increase. The index fell 0.1% from July on an unadjusted basis, while the seasonally adjusted monthly index rose 0.2%.
Those figures are not contradictory. The 3.0% rate compares prices with the same month one year earlier. The 0.1% decline compares August with July before seasonal adjustment. A household can therefore see a small monthly dip while prices remain materially higher than they were a year ago.
Gasoline still shaped the headline number. Prices were 22.8% higher than a year earlier, down from a 25.7% annual increase in July. Excluding gasoline, the Canada inflation rate accelerated from 2.2% in July to 2.4% in August.
The Bank of Canada’s two preferred core measures remained much calmer. CPI-median was 2.0% and CPI-trim was 1.9%, unchanged from July. That suggests the sharp energy increase had not spread broadly across the basket by August.
Provincial inflation makes the national average incomplete
The provincial CPI table shows a 2.7 percentage point spread between Ontario and Nova Scotia. Eight of the ten provinces were above the national 3.0% rate. British Columbia matched it, while Ontario was below it.
| Province | August 2026 inflation | Compared with Canada |
|---|---|---|
| Nova Scotia | 5.1% | 2.1 percentage points higher |
| New Brunswick | 4.6% | 1.6 percentage points higher |
| Manitoba | 4.4% | 1.4 percentage points higher |
| Prince Edward Island | 4.4% | 1.4 percentage points higher |
| Newfoundland and Labrador | 4.3% | 1.3 percentage points higher |
| Alberta | 3.8% | 0.8 percentage points higher |
| Saskatchewan | 3.5% | 0.5 percentage points higher |
| Quebec | 3.1% | 0.1 percentage points higher |
| British Columbia | 3.0% | Same as Canada |
| Ontario | 2.4% | 0.6 percentage points lower |
Atlantic Canada occupied four of the five highest positions. Statistics Canada pointed to fuel oil and other fuels, which rose 43.7% nationally from a year earlier after a 29.5% increase in July. Those fuels are used more often for home heating in Atlantic provinces, so the same national price shock has a larger effect on their provincial baskets.
The table does not mean every Ontario household experienced 2.4% inflation or every Nova Scotia household experienced 5.1%. CPI reflects the average basket used in each geography. A renter, driver, homeowner or frequent traveller can have a very different personal result.
What a 3% raise means on a $50,000 salary
A 3% raise takes a $50,000 salary to $51,500. The table below applies each province’s August annual CPI rate to the original salary, then compares that amount with the $1,500 raise.
| Province | Gross increase at provincial CPI | Difference from a 3% raise |
|---|---|---|
| Ontario | $1,200 | +$300 |
| British Columbia | $1,500 | $0 |
| Quebec | $1,550 | −$50 |
| Saskatchewan | $1,750 | −$250 |
| Alberta | $1,900 | −$400 |
| Newfoundland and Labrador | $2,150 | −$650 |
| Manitoba | $2,200 | −$700 |
| Prince Edward Island | $2,200 | −$700 |
| New Brunswick | $2,300 | −$800 |
| Nova Scotia | $2,550 | −$1,050 |
The largest shortfalls appear in Atlantic Canada. A New Brunswick worker receiving a 3% raise would be $800 below the simple provincial benchmark. In Prince Edward Island and Manitoba, the gap would be $700. Quebec is much closer, with a difference of only $50.
This calculation does not prove that a particular worker lost purchasing power. It compares one salary with an average price index. Income tax, Canada Pension Plan or Quebec Pension Plan contributions, Employment Insurance premiums and personal tax credits change the net result. Use the PaycheckGuru payroll calculator to compare the take-home amount before and after a proposed raise.
A raise matching one year of CPI also does not recover purchasing power lost in earlier years. It only prevents the latest 12-month gap from widening, assuming your own expenses moved like the provincial basket.
Grocery inflation slowed, but prices remain far above 2021
Food purchased from stores rose 2.8% from August 2025. This was the first month since July 2024 in which grocery inflation was lower than the all-items Canada inflation rate.
Dairy products led the slowdown. Their annual increase fell from 3.1% in July to 0.7% in August, with cheese and yogurt contributing most to the change. Pork, condiments, spices, vinegars and fresh fruit also rose more slowly.
Slower inflation is not the same as lower prices. Statistics Canada says grocery prices were 29.0% higher in August 2026 than in August 2021. A grocery bill that rose sharply over the previous five years does not reset when the annual rate drops to 2.8%.
Rent and travel moved in the other direction
Rent inflation accelerated nationally to 2.8% from 2.5% in July. Manitoba rents rose 4.3% over the year and Ontario rents rose 2.4%, making those provinces the main contributors to the national acceleration.
Travel tours were 26.1% more expensive than a year earlier, compared with a 15.2% annual increase in July. Statistics Canada attributed part of the jump to a base-year effect and part to fuel surcharges linked to higher jet-fuel prices.
Tour prices still fell 2.9% from July to August. That is another example of why annual and monthly figures answer different questions. Travel became cheaper than it was one month earlier, but much more expensive than it was in August 2025.
How to use the August inflation rate in a pay discussion
The provincial rate is a useful starting point for a salary review, but it is not an automatic entitlement or a complete measure of your finances. A practical comparison uses the same 12-month period on both sides: your current gross pay versus your gross pay one year earlier, then the relevant provincial CPI rate for that period.
- Calculate your percentage pay change, including any increase that took effect during the year.
- Compare it with your province’s annual CPI rate, not only the Canada inflation rate.
- Check the categories that dominate your own budget, especially rent, fuel and groceries.
- Compare net pay as well as gross salary because payroll deductions can change the amount available to spend.
- Treat benefits, pension contributions and paid time off separately from salary.
Hourly workers can convert a new rate into weekly, monthly and annual income with the salary conversion tool. Workers affected by the October changes can also review the existing minimum wage increase guide, which calculates the gross and after-deduction value of the new rates rather than repeating them here.
What the August report changes from July
July’s 3.0% headline rate was already covered in PaycheckGuru’s wage and inflation analysis. At the national level, August brought no further increase in the annual rate.
The new information is the widening geographic split. Provincial inflation now ranges from 2.4% to 5.1%, gasoline inflation remains high, rent growth accelerated and groceries moved below the headline rate for the first time in more than two years. Those changes produce a different answer to a practical question: whether the same percentage raise protects workers equally across Canada.
Statistics Canada will release the September CPI on Monday, October 19, 2026. Until then, 3.0% is the latest national annual rate, not a forecast for the months ahead.
Frequently asked questions
What was the Canada inflation rate in August 2026?
The Canada inflation rate was 3.0% from August 2025 to August 2026, unchanged from July’s annual rate. The unadjusted CPI fell 0.1% from July to August.
Which province had the highest inflation in August 2026?
Nova Scotia had the highest provincial rate at 5.1%. New Brunswick followed at 4.6%. Fuel oil and other fuels were an important source of pressure across Atlantic Canada.
Which province had the lowest inflation in August 2026?
Ontario had the lowest provincial rate at 2.4%. British Columbia was next at 3.0%, matching the national rate.
Is a 3% raise enough to keep up with inflation?
A 3% gross raise matched or exceeded the August provincial CPI benchmark only in Ontario and British Columbia. It trailed the annual rate in the other eight provinces. Your after-tax pay and personal inflation rate may produce a different result.
How can I calculate my personal inflation rate?
Statistics Canada’s Personal Inflation Calculator lets you enter spending by category and compare your result with the official CPI for an average Canadian household.
Sources: Statistics Canada, Consumer Price Index, August 2026, released September 14, 2026; Statistics Canada Table 18-10-0004-01 and provincial release table; Statistics Canada Personal Inflation Calculator. Salary examples and provincial comparisons calculated by PaycheckGuru. Figures last verified September 15, 2026.
2 thoughts on “Canada Inflation Rate August 2026: Is a 3% Raise Enough?”